I took all the results from my survey and to make more sense of them I made them into pie charts. This makes it easier to see trends and spot patterns. These are all of the questions I asked in the survey and a pie chart of all the 50 results I collected.

For this question it is clear that people of the age of my target audience feel that visuals are the most effective when they want to learn something. This is the method they would prefer to have when learning about the free running flip. I am going to take this into account when I am deciding how I am going to teach people the flip.

There is a clear majority that thinks a video of 3-5 minutes is the most effective. It means that it will not be too long that it becomes boring or too short that you don't have time to learn anything. This is useful and if I decide to do a video I will take this into account so that my final product satisfies my target audience.

As with the last question I will take into account that the majority of the people that answered my survey thought that a presentation of 10-20 minutes would be the most effective. In my opinion this is true and it will be a useful piece of research if I do a presentation because it means that I am satisfying the needs of my target audience so that they learn in the best possible way.

For this questions people preferred an interactive activity of more than half an hour to be able to learn something properly. This is a good source for my research if I decide to do an interactive activity. I means I can make it in the way that my target audience would prefer it.
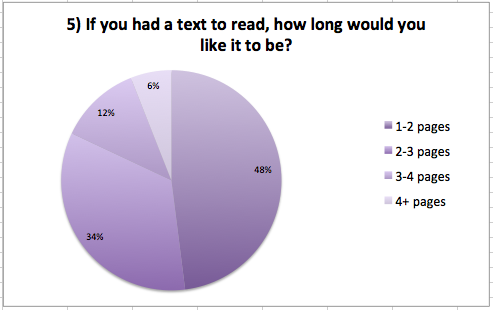
Most people found that 1-2 pages would be sufficient to explain the free running flip with the analysis and for them to understand it. This is all useful for when I decide which method I will use to teach my target audience.
No comments:
Post a Comment